In school, the periodic table made chemistry manageable. 118 elements, each with a defined role and a precise place in the larger system. You didn't have to memorise every reaction — the table gave you the map, and the map changed how you thought about the subject entirely.
Something similar now exists for artificial intelligence in Product Lifecycle Management. Forty distinct AI capabilities, organised into eight logical categories, each solving a specific problem that PLM environments face every single day. It's not a product. It's not a vendor pitch. It's a framework — and a well-built framework changes how you diagnose problems before you even start solving them.
What PLM Is — and Why AI Matters Here
Product Lifecycle Management is the system of processes, tools, and data that tracks a physical product from its earliest design concept through manufacturing, service, and eventual retirement. Every part number, every engineering drawing, every change order, every compliance document — PLM holds it.
The industries that depend on PLM are the ones building complex things at scale — aerospace, automotive, industrial machinery, electronics, medical devices. PLM systems are extraordinarily data-rich and, historically, very insight-poor. Enormous volumes of structured data, mostly navigated by engineers doing manual checks, chasing approvals, and reconciling mismatches between design and manufacturing reality. AI doesn't replace that work. It makes it faster, more accurate, and far less prone to the kinds of human error that cost companies weeks of expensive rework.
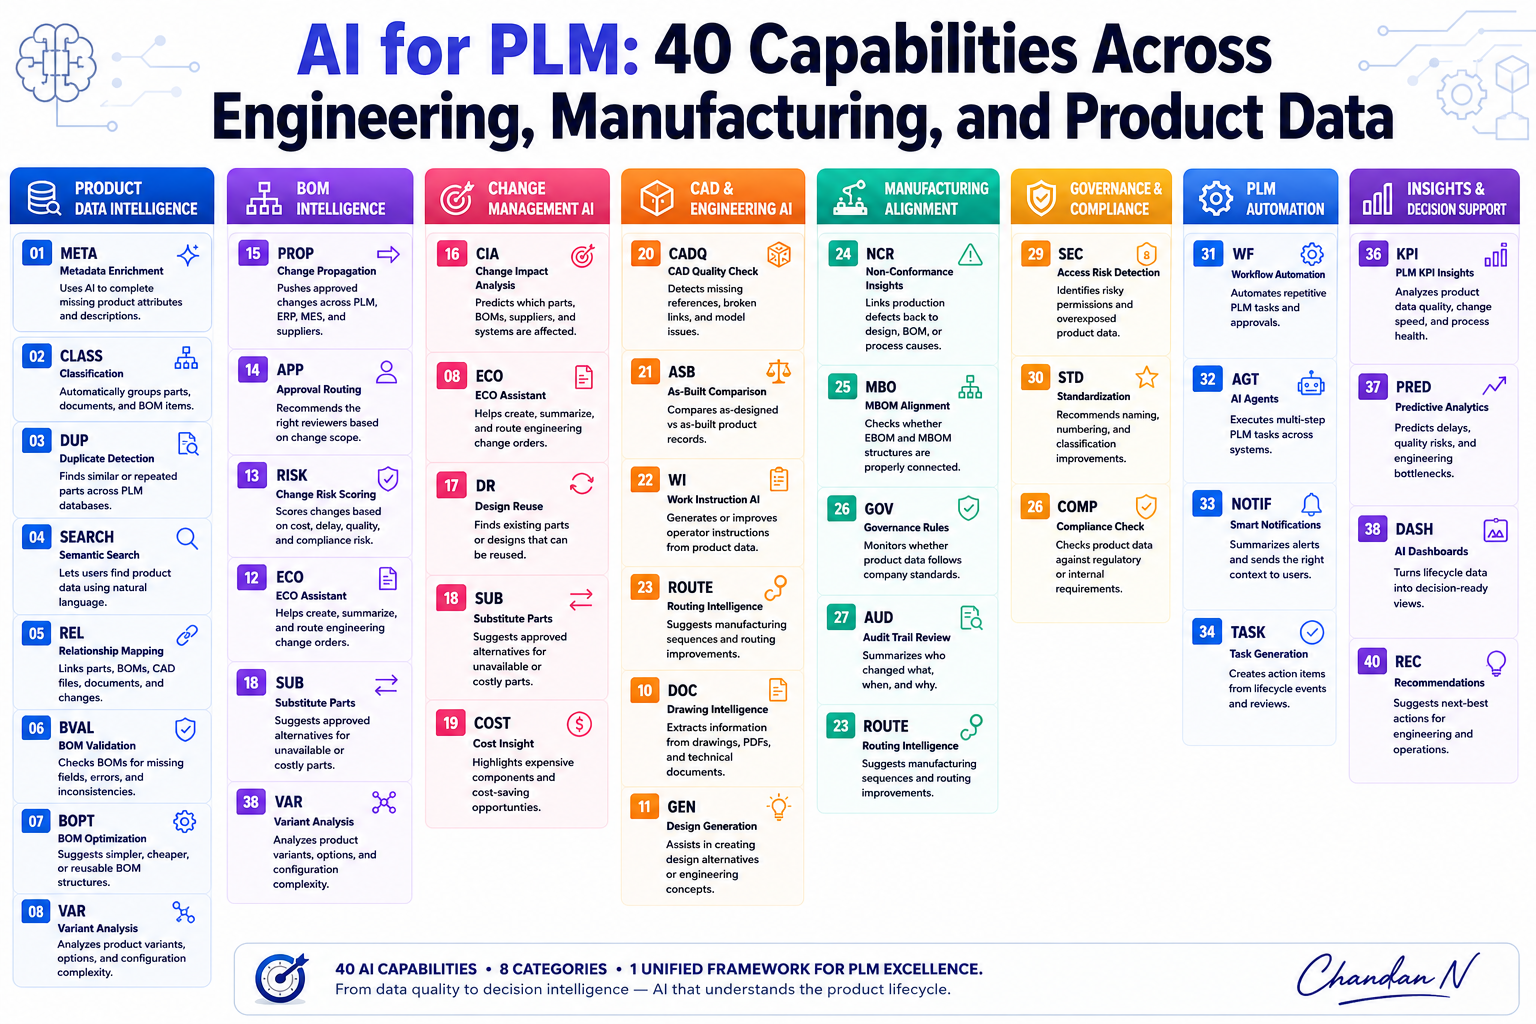
The Framework: 40 Elements, 8 Categories
The framework organises 40 discrete AI capabilities into eight functional groups. Each capability carries a short code — think of it like a chemical symbol — and a precise, specific job. This creates a shared vocabulary: a way to name things that previously had no common language across vendors, consultants, and engineering teams.
Layer 1 — The Data Foundation Everything Else Depends On
META (Metadata Enrichment) uses AI to complete missing product attributes automatically. CLASS (Classification) groups parts and BOM items into logical categories without manual tagging. DUP (Duplicate Detection) finds similar or repeated parts lurking across PLM databases — a problem that compounds silently over years. SEARCH (Semantic Search) lets engineers find product data using plain natural language rather than memorising exact part codes.
REL (Relationship Mapping) links parts, BOMs, CAD files, documents, and changes together — making the invisible connections between data visible. BVAL (BOM Validation) checks Bills of Materials for errors before they reach manufacturing. BOPT (BOM Optimisation) identifies opportunities to consolidate BOM structures. VAR (Variant Analysis) handles the complexity of product variants and configurations.
Layer 2 — Where Product Development Schedules Quietly Collapse
PROP (Change Propagation) pushes approved changes automatically across PLM, ERP, MES, and supplier systems. APP (Approval Routing) recommends the right reviewers for each change based on scope. RISK (Change Risk Scoring) evaluates every proposed change for cost, delay, quality, and compliance exposure — before approval, not after the damage is done.
CIA (Change Impact Analysis) is the most underrated capability in this entire framework. It predicts which parts, BOMs, suppliers, and systems will be affected by a proposed change — the full blast radius before commitment. ECO Assistant helps create and route change orders. SUB (Substitute Parts) surfaces approved alternatives for unavailable components. COST (Cost Insight) highlights expensive elements directly in the change workflow.
Layer 3 — Closing the Gap Between Design and the Shop Floor
CADQ (CAD Quality Check) detects missing references and model issues before they propagate downstream. DR (Design Reuse) finds existing parts that can be reused rather than redesigned. GEN (Design Generation) assists in creating design alternatives. DOC (Drawing Intelligence) extracts structured information from drawings and PDFs automatically.
On the manufacturing side, ASB (As-Built Comparison) compares as-designed versus as-built records. NCR (Non-Conformance Insights) links production defects back to their root cause in design or BOM. ROUTE (Routing Intelligence) suggests optimised manufacturing sequences. WI (Work Instruction AI) generates operator instructions directly from product data. MBO (MBOM Alignment) verifies that engineering and manufacturing BOM structures are properly connected.
Layer 4 — Governance, Agents, and Intelligent Automation
AGT (AI Agents) is the element most worth watching in this entire framework. It represents the shift from AI as a tool you query to AI as an actor that executes multi-step PLM tasks autonomously — the practical difference between a search engine and a capable colleague. WF (Workflow Automation) handles repetitive PLM tasks without human intervention. TASK (Task Generation) creates action items from lifecycle events. NOTIF (Smart Notifications) routes context-aware alerts to the right users. SUM (Summarisation) condenses changes and BOMs into readable summaries.
Layer 5 — Turning PLM from a Data Archive into a Decision Engine
KPI (PLM KPI Insights) analyses product data quality, change speed, and process health. PRED (Predictive Analytics) forecasts delays, quality risks, and engineering bottlenecks before they materialise. DASH (AI Dashboards) turns lifecycle data into decision-ready views. ROOT (Root Cause Analysis) identifies underlying causes behind product or process issues — the difference between fixing a symptom today and preventing the same problem from recurring. REC (Recommendations) suggests next-best actions for engineering and operations teams based on live product data.
How to Use This Framework Practically
No organisation needs all 40 capabilities running simultaneously. The value is in having a complete map of what's possible — so you can precisely diagnose what's absent from your current environment rather than guessing.
- If your ECO cycles are averaging three weeks, the gaps are likely CIA, RISK, and APP
- If your shop floor keeps producing non-conformances tied to drawing interpretation, the starting point is WI and NCR
- If leadership can't get a clear picture of product health without a weekly manual report, the missing elements are DASH, KPI, and PRED
- If BOM duplication is a persistent problem, the fix starts with DUP, BVAL, and REL in Layer 1
The framework also gives PLM professionals a sharper way to have conversations with stakeholders who aren't PLM specialists. Instead of explaining system architecture, you can point to specific capabilities and their direct business outcomes. That shift — from a technical conversation to a value conversation — is not a minor one in environments where budget and attention are competitive.
AI in PLM is no longer a future concept or an experimental investment. The capabilities exist, they're being deployed, and the gap between organisations that understand this framework and those that don't is widening. The question worth asking is not whether to engage with AI in PLM. It's which elements are currently missing from your stack — and what that absence is costing you.
Written from hands-on PLM implementation experience across Transport & Mobility and Aerospace & Defence programs. Views are my own.